A little set of graphs today that look at the daily case numbers for a few countries since the pandemic began in earnest.
I'm going to use column graphs today and ideally, what you want to see is a 'shape' that draws a downward curve from some peak point. I've drawn in the 3rd or 4th order polynomial trend lines (in purple) to show that shape.
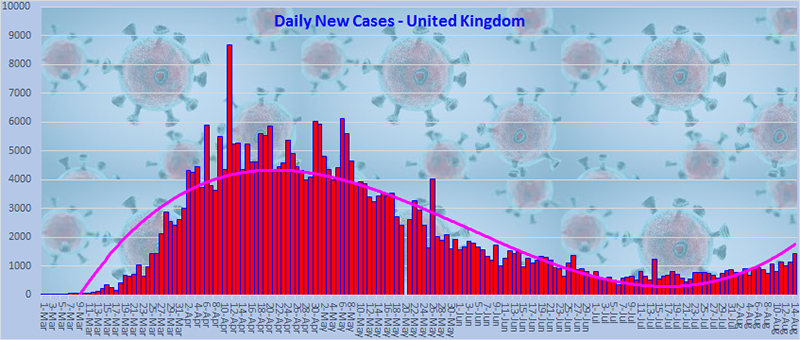
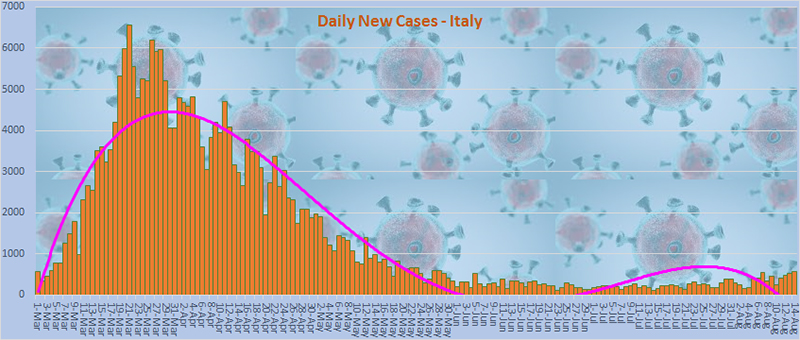
First up are a couple of countries that, while not ideally shaped, are close to it - the United Kingdom and Italy which both had high early case numbers but then have tapered down since mid-April (Italy) and mid-May (UK) and although the UK has started a second upward trend recently, it's not steep while Italy started a second but also stopped it quickly. Both of these are 4th order polynomial trends.
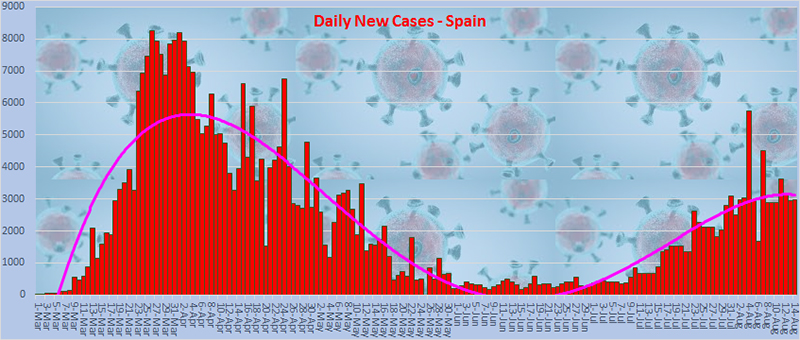
The next pairing are Spain and Australia. Both show signs of a second wave with the Australian second wave actually more severe than the first wave but both those second waves have also tapered off or started to reverse in recent days. The trends are 3rd order polynomials.

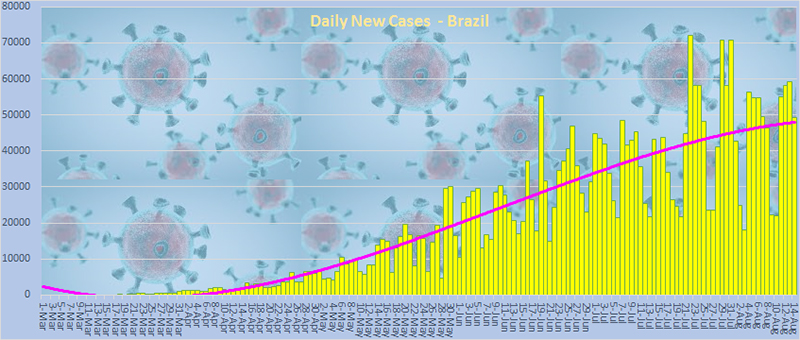
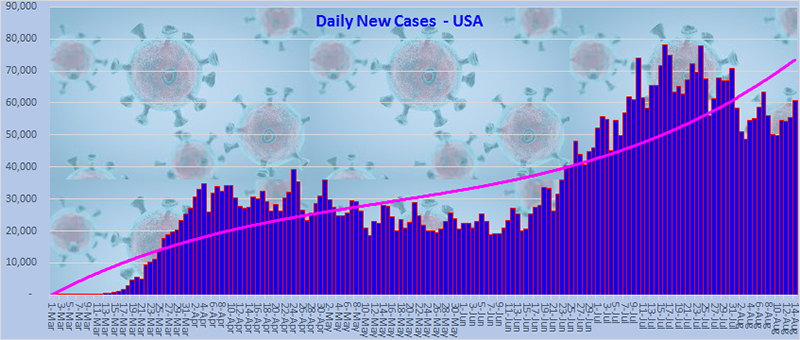
Finally, a pair that are exactly what you don't want to see; the United States and Brazil - one of which is still largely following the herd immunity approach and the other which just seems to be full of idiots; both countries probably being led by one (an idiot that is) as well. Neither of these graphs have shown any real sign of doing anything other than climbing and even the little dip in the USA trend curve was short lived.