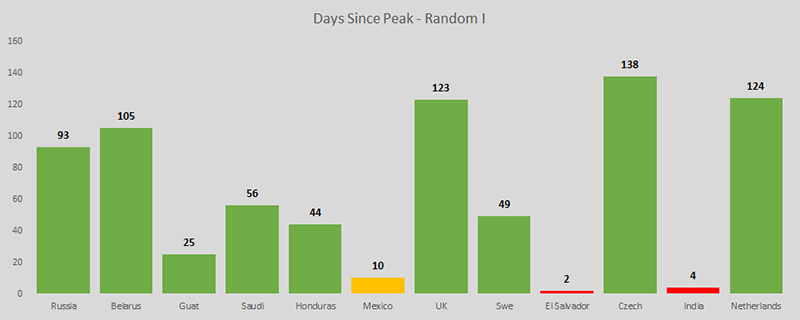
Let's have some new graphs today. These look at the number of days since the 'peak' of each countries daily case numbers. It's a bit different from the 90th percentile data we looked at last week.
Those in
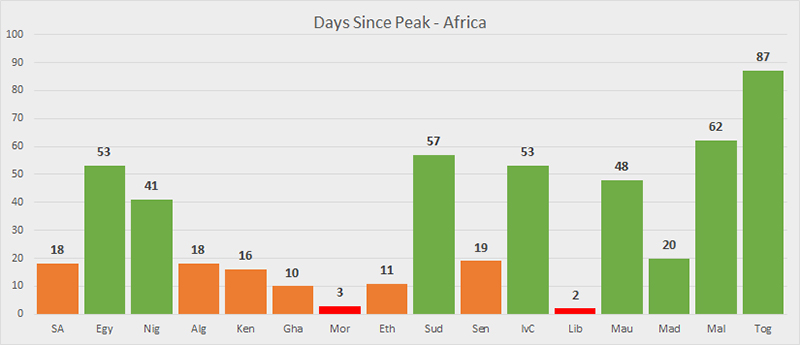
red are less than 7 days since their peak;
orange are 8-19 days and
green are > 20 days.
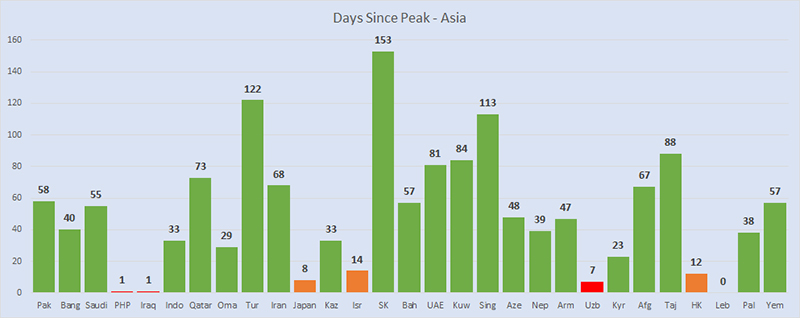
First up are some Asian countries:
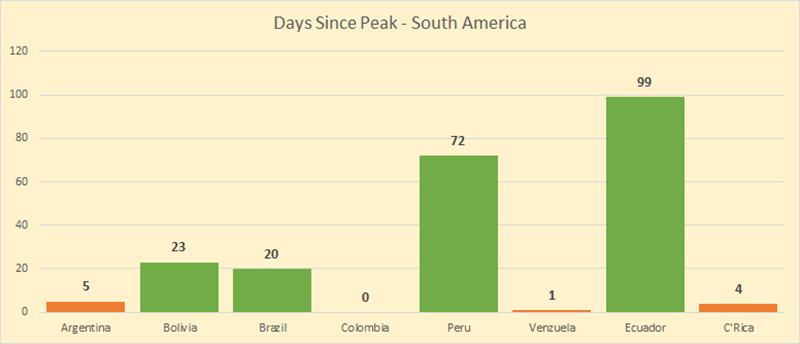
South America:
Africa:
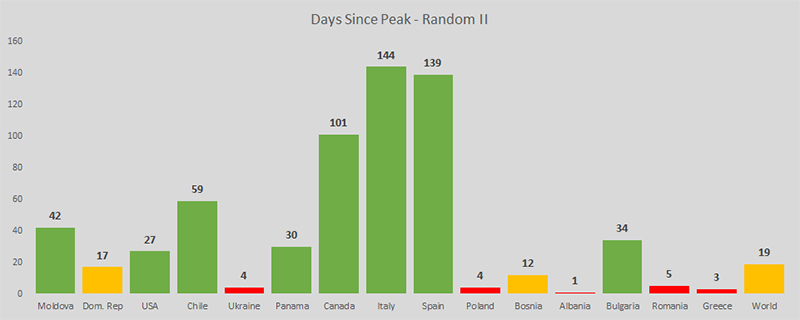
.. and two groups of random countries, mostly Europe or North America